Opening Range Fade

The breakout is expected to accelerate. Frequently, it simply stalls. As documented at orb trading basics ambrozia avl, the mechanics of an opening range fade rely on identifying these specific moments of exhaustion. Traders often look for momentum during the market open, but the absence of volume turns a breakout into a trap. This intraday strategy looks for the reversal rather than the continuation.
Identifying Exhaustion
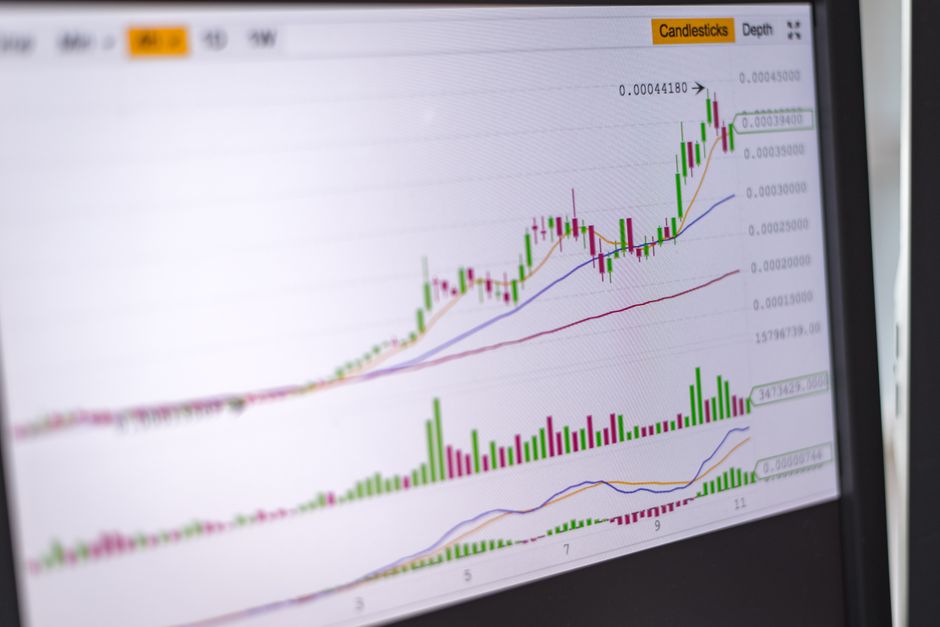
An opening range breakout fails when price moves beyond the initial boundaries without a corresponding surge in volume. The first fifteen minutes often set a direction, but a lack of participation from institutional participants suggests the move is hollow. Look for a price action that drifts into new territory with declining relative volume. When the price hits a new session high on low volume, the probability of a reversal increases. The move lacks the fuel required to sustain the trend through the first hour of the session. Mechanical execution requires watching the tape for signs that sellers are stepping in at the extremes.
Defining the Range
The choice of timeframe dictates the setup. Using a five minute range provides more frequent signals, but these often contain noise. A thirty minute range offers a more stable foundation for identifying true exhaustion. When the price breaches the thirty minute range on low volume, the fade targets the midpoint or the opposite side of the initial boundary. The setup is not about guessing tops, but about reacting to the failure of a momentum move. The trader waits for a candle to close back inside the established boundaries to confirm the lack of follow through.
Volume and Divergence
Volume serves as the primary filter. A valid opening range breakout requires a spike in volume to confirm intent. If the price moves away from the opening bell with a shrinking volume profile, the move is a candidate for a fade. This divergence between price and effort is a mechanical signal. The trade is entered once a reversal candle forms within the timeframe. Monitoring the relationship between price and volume provides the data necessary to avoid getting caught in actual trends. A small sample of trades over several weeks will show that volume profiles are the most consistent indicator of exhaustion.
Execution and Risk
Risk management involves placing stops above the recent failed high. The target is typically the mean of the opening range or the low of the initial move. This is not a way to predict the day, but a way to exploit a specific inefficiency at the cash open. If the price continues to trend on increasing volume, the fade is invalidated immediately. Exit the position if the price makes a new high on higher volume than the previous candles. The goal is to capture the mean reversion that follows a low volume expansion.